Turn work logs into a monthly summary table and chart
Validate dates and work hours in a CSV, then save monthly record counts and total hours as a CSV and a bar chart.
Content checked 2026.09.19Example files included
Show contents
This translation was generated by AI. Check the code, units, and numbers against the original. Native-speaker review has not yet been completed for each language. 한국어
Who this is forOffice staff who want to handle recurring monthly work summaries with simple Python code
What you need
Have Python 3.12 and a terminal ready. Check the version with python --version.
Extract the entire downloaded ZIP and open a terminal in the folder containing example.py.
Start with the included practice data, then compare the results with the original files.
This example uses work_log.csv and Matplotlib. The CSV must use UTF-8 or UTF-8 BOM encoding.
01Start by defining what one row means
Treat each row as one work record and add hours to the month containing its date. record_count is the number of rows, not the number of people or working days. hours uses decimal hours. 1.50 means 1 hour and 30 minutes, not 1 hour and 50 minutes.
The included data contains 9 fictional work records for January through March 2026. This is an exercise in adding existing numbers by month, not a tool for measuring work time or evaluating performance.
02Check the input columns and values
Column
Format
Validation rule
record_id
Text such as R001
Must be unique within the file
date
2026-01-06
YYYY-MM-DD; a date that actually exists
task
자료 정리
Must not be empty
hours
2.50
A finite number of 0 or more, with up to two decimal places
Do not add title rows, total rows, or numbers containing commas. If the script finds a duplicate ID, it stops to prevent double counting. Records with different IDs are counted separately even if their task descriptions match.
03Prepare the files and run the example
Extract the ZIP and check that the input file listed in README.txt is in the same folder as example.py. Do not run the example from inside the ZIP archive.
Run the commands below one line at a time in the folder containing example.py. On Windows, if python is unavailable but py is available, replace python in each command with py -3.12.
After the completion message appears, open the new outputs folder. If outputs already exists, first rename it to keep the previous results, then run the example again.
Installation requires an internet connection. BASE in the code sets the input and output paths relative to example.py, not the current terminal folder.
04Full code and aggregation method
The code validates dates with date.fromisoformat and creates month keys in YYYY-MM format. It adds hours with Decimal and writes them to the table with two decimal places. Values are converted to ordinary floating-point numbers only for plotting. Agg mode saves a PNG instead of opening a chart window.
example.py
"""Summarize fictional work-log records by calendar month."""
import csv
import math
from collections import defaultdict
from datetime import date
from decimal import Decimal, InvalidOperation
from pathlib import Path

import matplotlib
matplotlib.use("Agg")
import matplotlib.pyplot as plt

BASE = Path(__file__).resolve().parent
HEADERS = ["record_id", "date", "task", "hours"]


def main():
    destination = BASE / "outputs"
    if destination.exists():
        raise ValueError("outputs already exists; rename it before running again.")
    totals = defaultdict(lambda: {"records": 0, "hours": Decimal("0")})
    seen = set()
    with (BASE / "work_log.csv").open(encoding="utf-8-sig", newline="") as file:
        reader = csv.DictReader(file)
        if reader.fieldnames != HEADERS:
            raise ValueError(f"Expected headers: {HEADERS}")
        for line, row in enumerate(reader, start=2):
            if None in row or any(value is None or not value.strip() for value in row.values()):
                raise ValueError(f"Row {line}: missing or extra field.")
            if row["record_id"] in seen:
                raise ValueError(f"Row {line}: duplicate record_id.")
            seen.add(row["record_id"])
            parsed_date = date.fromisoformat(row["date"])
            if parsed_date.isoformat() != row["date"]:
                raise ValueError(f"Row {line}: use YYYY-MM-DD dates.")
            try:
                hours = Decimal(row["hours"])
            except InvalidOperation as error:
                raise ValueError(f"Row {line}: hours must be a number.") from error
            if not hours.is_finite() or hours < 0 or hours.as_tuple().exponent < -2:
                raise ValueError(f"Row {line}: hours must be finite, nonnegative, with at most 2 decimals.")
            month = parsed_date.strftime("%Y-%m")
            totals[month]["records"] += 1
            totals[month]["hours"] += hours
    if not totals:
        raise ValueError("No work records were found.")

    months = sorted(totals)
    figure, axis = plt.subplots(figsize=(8, 4.6), layout="constrained")
    values = [float(totals[month]["hours"]) for month in months]
    if not all(math.isfinite(value) and math.isfinite(value * 1.2) for value in values):
        plt.close(figure)
        raise ValueError("Monthly total is too large to plot as a finite number.")
    bars = axis.bar(months, values, color="#2B6578", width=0.55)
    axis.bar_label(bars, labels=[f"{value:.2f}" for value in values], padding=4)
    axis.set(title="Monthly work hours | Fictional data", xlabel="Calendar month", ylabel="Hours")
    axis.set_ylim(0, max(values) * 1.2 if max(values) > 0 else 1)
    axis.spines[["top", "right"]].set_visible(False)
    axis.set_axisbelow(True)
    axis.grid(axis="y", alpha=0.2)
    destination.mkdir(exist_ok=False)
    with (destination / "monthly_summary.csv").open("x", encoding="utf-8-sig", newline="") as file:
        writer = csv.writer(file)
        writer.writerow(["month", "record_count", "total_hours"])
        for month in months:
            writer.writerow([month, totals[month]["records"], f"{totals[month]['hours']:.2f}"])
    figure.savefig(destination / "monthly_hours.png", dpi=160)
    plt.close(figure)
    total_hours = sum((values["hours"] for values in totals.values()), Decimal("0"))
    print(f"Records: {len(seen)}; months: {len(months)}; hours: {total_hours:.2f}")
    print("Created outputs/monthly_summary.csv and outputs/monthly_hours.png.")


if __name__ == "__main__":
    try:
        main()
    except (OSError, ValueError, csv.Error) as error:
        raise SystemExit(f"Stopped: {error}") from error
05Read the summary table and chart
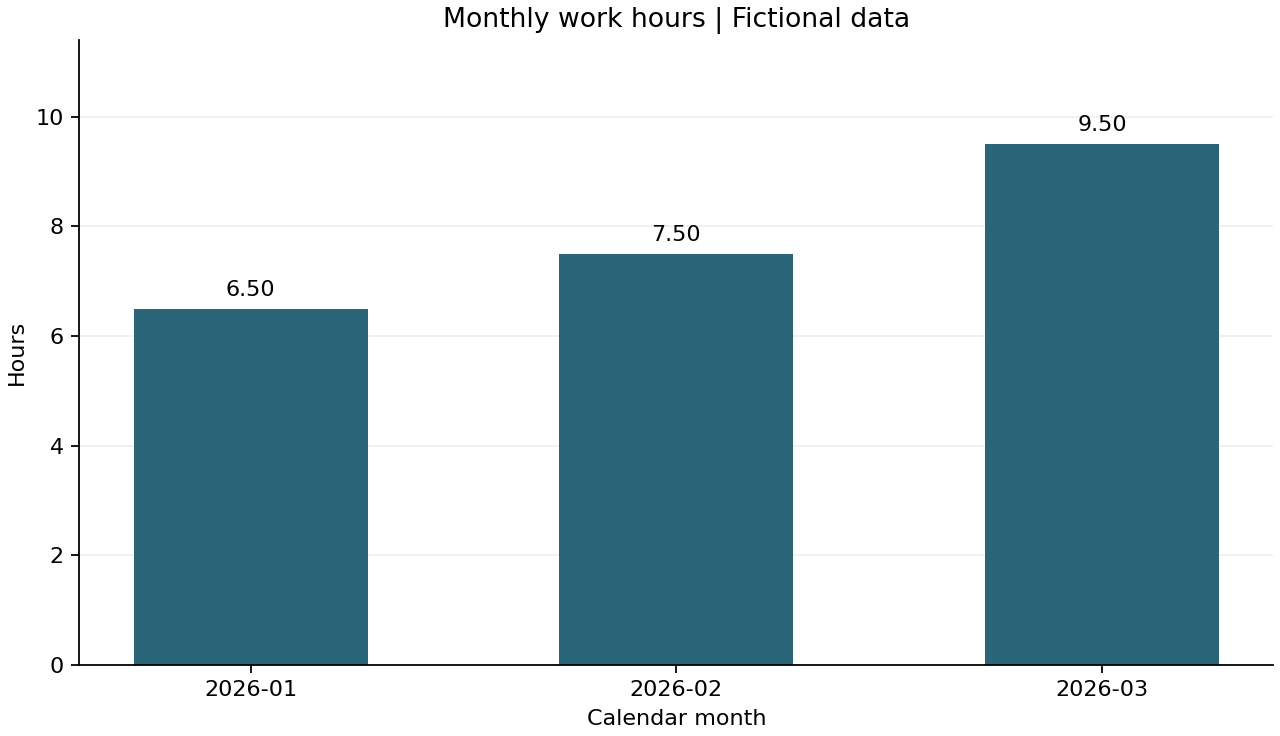
The script creates outputs/monthly_summary.csv and outputs/monthly_hours.png. The chart shows only months present in the input, sorted by year and month. English axis labels let the example run without installing a separate Korean font.
month
record_count
total_hours
2026-01
3
6.50
2026-02
3
7.50
2026-03
3
9.50
Overall total for checking
9
23.50
Monthly hours chart for fictional work records. January: 6.5 hours; February: 7.5 hours; March: 9.5 hours.
06Check totals and month boundaries
In the summary CSV, check that January totals 2.50 + 1.00 + 3.00 = 6.50 hours.
Check that the sum of monthly record_count values matches the 9 input records.
Check that total_hours sums to 23.50 and compare each month's value with the number on its chart bar.
Copy the practice folder, change the last record's date to 2026-04-01, and run again. Check that the hours are split into 5.50 for March and 4.00 for April.
07When a date or number stops the script
Problem
How to fix it
duplicate record_id
Check whether the same record was entered twice.
day is out of range / Invalid isoformat
Check for impossible dates such as 2026-02-30 or an incorrect date format.
hours must be a number
Enter only a number such as 2.5 for hours. Remove unit labels and thousands separators.
hours must be finite…
Check for negative values, NaN, Infinity, or more than two decimal places.
Korean text appears garbled
Save the original CSV again in UTF-8.
outputs already exists
Keep the previous results, then rename the result folder.
08Know the limits before using the results in a report
Records containing dates only are grouped by calendar month. Start and end times, night shifts, time zones, and tasks crossing midnight are not handled.
Months with no input are not added as rows with 0 hours. Missing records must be distinguished from actual 0 hours.
Only duplicate IDs are blocked. Check the original data for the same task entered twice under different IDs.
The summary CSV and PNG reflect the data at execution time. After editing the CSV, run the script again to get new results.
Execution and verification record
Windows 11 (10.0.26200), CPython 3.12.14 (64-bit). openpyxl 3.1.5, Matplotlib 3.10.8. The libraries used by each example are pinned in requirements.txt.
Confirmed 3 monthly rows, 23.50 hours, and 9 records
Verified PNG creation and results after changing a record across a month boundary
Checked invalid dates, duplicate IDs, negative/NaN hours, and header errors
Confirmed unchanged original hashes and preservation of existing results
Verification limits
Matching the aggregation rules of actual HR or attendance systems is outside the verification scope.
Find rows with exact matches in all four columns and collect them in a new Excel file with their original row numbers. Review each duplicate group, including its first occurrence.