Automotive & data work10
Check the time axis and units of a test CSV first
Check units, missing values, finite numbers, and duplicate or reversed timestamps in synthetic demonstration data, then save the check results and a chart.
Validate three synthetic demonstration CSV files, then overlay curves that share the same time samples and acceleration units on one chart.
This translation was generated by AI. Check the code, units, and numbers against the original. Native-speaker review has not yet been completed for each language. 한국어
Who this is forPython beginners in the automotive field who want to overlay test results from multiple conditions
To overlay several curves in one chart, time and the vertical-axis units must mean the same thing. This example plots the synthetic demonstration data Case A, Case B, and Case C on common axes of time in s and acceleration in m/s^2. Condition names are read from the condition column in each file.
The script reads the .csv files in the inputs folder in name order. There must be at least two files, and each file must contain only one condition. Every row must have six columns: dataset_note, condition, time, time_unit, acceleration, and acceleration_unit.
| Field | Included example |
|---|---|
| dataset_note | Synthetic demonstration data |
| condition | Case A (ASCII letters and numbers) |
| time / time_unit | 0.0 / s |
| acceleration / acceleration_unit | 0.8 / m/s^2 |
This example compares only when the time arrays of the files are exactly the same. It stops if the number of samples, the start time, or any time value differs. The chart axis shows the shared unit as m/s².
python --version
python -m pip install -r requirements.txt
python example.py
Installation requires an internet connection. BASE in the code sets the input and output paths relative to example.py, not the current terminal folder.
After checking the time order and units in each file, it checks for duplicate condition names. It compares the remaining arrays against the time array of the first file, and adds lines to one Axes only when all of them match. Sorting, time shifting, interpolation, and unit conversion are not done automatically.
"""Overlay explanatory synthetic test conditions on the same axes.

All files must have the same explicit units and matching time samples.
No interpolation, clock shifting, filtering, or safety assessment is performed.
"""
import csv
import math
from pathlib import Path

import matplotlib
matplotlib.use("Agg")
import matplotlib.pyplot as plt

BASE = Path(__file__).resolve().parent
HEADERS = ["dataset_note", "condition", "time", "time_unit", "acceleration", "acceleration_unit"]
NOTE = "설명용 합성 데이터"


def read_condition(path):
    times, values = [], []
    label = None
    with path.open(encoding="utf-8-sig", newline="") as file:
        reader = csv.DictReader(file)
        if reader.fieldnames != HEADERS:
            raise ValueError(f"{path.name}: expected headers {HEADERS}")
        for line, row in enumerate(reader, start=2):
            if None in row or any(value is None or not value.strip() for value in row.values()):
                raise ValueError(f"{path.name}:{line}: missing or extra field.")
            if row["dataset_note"] != NOTE:
                raise ValueError(f"{path.name}:{line}: synthetic-data label is required.")
            if row["time_unit"] != "s" or row["acceleration_unit"] != "m/s^2":
                raise ValueError(f"{path.name}:{line}: expected units s and m/s^2; no automatic conversion.")
            if not row["condition"].isascii():
                raise ValueError(f"{path.name}:{line}: use an ASCII condition label for portable plotting.")
            label = row["condition"] if label is None else label
            if row["condition"] != label:
                raise ValueError(f"{path.name}:{line}: condition label changes within one file.")
            time, value = float(row["time"]), float(row["acceleration"])
            if not math.isfinite(time) or not math.isfinite(value) or time < 0:
                raise ValueError(f"{path.name}:{line}: expected finite values and nonnegative time.")
            if times and time <= times[-1]:
                raise ValueError(f"{path.name}:{line}: duplicate or decreasing time.")
            times.append(time)
            values.append(value)
    if len(times) < 2:
        raise ValueError(f"{path.name}: at least two samples are required.")
    return label, times, values


def main():
    destination = BASE / "outputs"
    if destination.exists():
        raise ValueError("outputs already exists; rename it before running again.")
    paths = sorted((BASE / "inputs").glob("*.csv"))
    if len(paths) < 2:
        raise ValueError("At least two CSV files are required in inputs.")
    conditions = [read_condition(path) for path in paths]
    if len({label for label, _, _ in conditions}) != len(conditions):
        raise ValueError("Condition labels must be unique across files.")
    reference_times = conditions[0][1]
    if any(times != reference_times for _, times, _ in conditions[1:]):
        raise ValueError("Time samples do not match; check alignment before comparison.")

    figure, axis = plt.subplots(figsize=(8, 4.6), layout="constrained")
    for label, times, values in conditions:
        axis.plot(times, values, marker="o", linewidth=2, label=label)
    axis.set(title="Test conditions | Explanatory synthetic data", xlabel="Elapsed time (s)", ylabel="Acceleration (m/s²)")
    axis.spines[["top", "right"]].set_visible(False)
    axis.grid(alpha=0.2)
    axis.legend(frameon=False)
    destination.mkdir(exist_ok=False)
    with (destination / "comparison_summary.csv").open("x", encoding="utf-8-sig", newline="") as file:
        writer = csv.writer(file)
        writer.writerow(["dataset_note", "condition", "sample_count", "min_acceleration", "max_acceleration", "unit"])
        for label, _, values in conditions:
            writer.writerow([NOTE, label, len(values), min(values), max(values), "m/s^2"])
    figure.savefig(destination / "synthetic_comparison.png", dpi=160)
    plt.close(figure)
    print(f"Explanatory synthetic data: {len(conditions)} conditions, {len(reference_times)} matching time samples each.")
    print("Created outputs/comparison_summary.csv and outputs/synthetic_comparison.png.")


if __name__ == "__main__":
    try:
        main()
    except (OSError, ValueError, csv.Error) as error:
        raise SystemExit(f"Stopped: {error}") from error
The three conditions are overlaid in outputs/synthetic_comparison.png. outputs/comparison_summary.csv stores the number of samples and the minimum and maximum acceleration for each condition. These numbers are a simple summary of synthetic demonstration data.
| Condition | Samples | Minimum | Maximum |
|---|---|---|---|
| Case A | 6 | 0.0 m/s² | 1.4 m/s² |
| Case B | 6 | 0.0 m/s² | 1.1 m/s² |
| Case C | 6 | 0.0 m/s² | 1.7 m/s² |
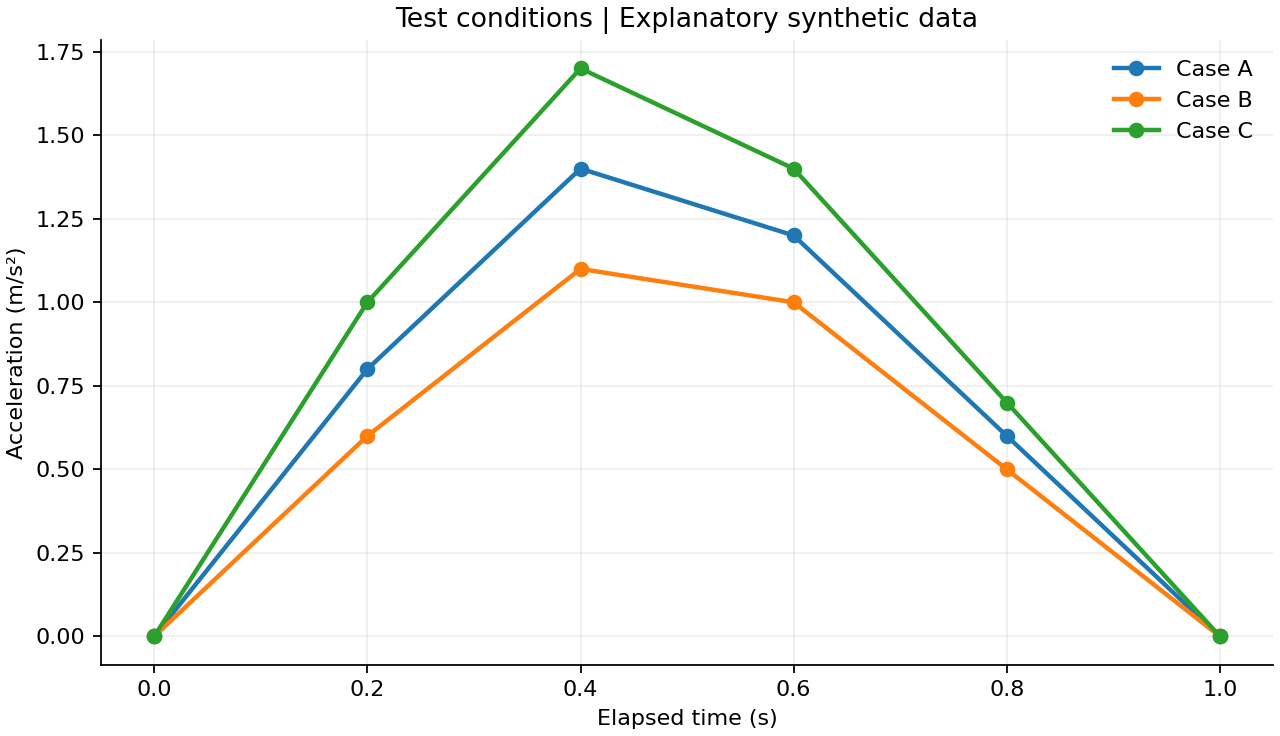
At the 0.4 s sample, the values of the three curves are 1.4, 1.1, and 1.7 m/s². The lines in the chart connect the samples; they do not create new measured values between them.
| Message | What to check |
|---|---|
| expected units s and m/s^2 | Check the actual units and notation in the exported file. |
| duplicate or decreasing time | Check the time order in that file and row. |
| Time samples do not match | Check the start time, sampling interval, and missing samples. Do not simply overwrite the times without knowing the cause. |
| Condition labels must be unique | Use a different condition name for each file. |
| condition label changes | Check that one file does not mix several conditions. |
| At least two CSV files | Check that the input files are in the inputs folder. |
Windows 11 (10.0.26200), CPython 3.12.14 (64-bit). openpyxl 3.1.5, Matplotlib 3.10.8. The libraries used by each example are pinned in requirements.txt.
Includes code, input data, and instructions. Extract the ZIP and read README.txt first.
Download example ZIPExample code, filenames, and input keys remain unchanged. Refer to the commands and checking steps in the translated article as well.
The explanations and examples were written for this site. See the official sources below for the related behavior and concepts.