자동차·데이터 실무10
시험 CSV의 시간축과 단위를 먼저 확인하기
설명용 합성 데이터에서 단위, 누락값, 유한수, 시간 중복·역행을 확인하고 점검 결과와 그래프를 저장합니다.
세 개의 설명용 합성 CSV를 검증한 뒤, 같은 시간 표본과 가속도 단위를 쓰는 곡선을 한 그래프에 겹쳐 그립니다.
이런 분께여러 조건의 시험 결과를 겹쳐 그리려는 자동차 분야 파이썬 입문자
여러 곡선을 한 그림에 겹치려면 시간과 세로축 단위의 의미가 같아야 합니다. 이 예제는 설명용 합성 데이터 Case A, Case B, Case C를 시간 s, 가속도 m/s^2의 공통 축에 표시합니다. 조건 이름은 파일 안의 condition 열에서 읽습니다.
inputs 폴더 안의 .csv 파일을 이름순으로 읽습니다. 파일은 최소 두 개이며 각 파일은 한 조건만 담아야 합니다. 모든 행에 dataset_note, condition, time, time_unit, acceleration, acceleration_unit 여섯 열이 있어야 합니다.
| 필드 | 동봉 예시 |
|---|---|
| dataset_note | 설명용 합성 데이터 |
| condition | Case A (영문·숫자 등 ASCII) |
| time / time_unit | 0.0 / s |
| acceleration / acceleration_unit | 0.8 / m/s^2 |
이 예제는 파일끼리 시간 배열이 정확히 같은 경우만 비교합니다. 표본 개수, 시작 시각, 시간 중 하나라도 다르면 중지합니다. 그래프 축에는 같은 단위를 m/s²로 표시합니다.
python --version
python -m pip install -r requirements.txt
python example.py
설치는 인터넷 연결이 필요합니다. 코드의 BASE는 현재 터미널 위치가 아니라 example.py의 위치를 기준으로 입력과 결과 경로를 정합니다.
각 파일에서 시간 순서와 단위를 검사한 뒤 조건 이름의 중복을 확인합니다. 첫 파일의 시간 배열을 기준으로 나머지 배열을 비교하고, 모두 일치할 때 한 Axes에 선을 추가합니다. 정렬·시간 이동·보간·단위 변환은 자동 수행하지 않습니다.
"""Overlay explanatory synthetic test conditions on the same axes.

All files must have the same explicit units and matching time samples.
No interpolation, clock shifting, filtering, or safety assessment is performed.
"""
import csv
import math
from pathlib import Path

import matplotlib
matplotlib.use("Agg")
import matplotlib.pyplot as plt

BASE = Path(__file__).resolve().parent
HEADERS = ["dataset_note", "condition", "time", "time_unit", "acceleration", "acceleration_unit"]
NOTE = "설명용 합성 데이터"


def read_condition(path):
    times, values = [], []
    label = None
    with path.open(encoding="utf-8-sig", newline="") as file:
        reader = csv.DictReader(file)
        if reader.fieldnames != HEADERS:
            raise ValueError(f"{path.name}: expected headers {HEADERS}")
        for line, row in enumerate(reader, start=2):
            if None in row or any(value is None or not value.strip() for value in row.values()):
                raise ValueError(f"{path.name}:{line}: missing or extra field.")
            if row["dataset_note"] != NOTE:
                raise ValueError(f"{path.name}:{line}: synthetic-data label is required.")
            if row["time_unit"] != "s" or row["acceleration_unit"] != "m/s^2":
                raise ValueError(f"{path.name}:{line}: expected units s and m/s^2; no automatic conversion.")
            if not row["condition"].isascii():
                raise ValueError(f"{path.name}:{line}: use an ASCII condition label for portable plotting.")
            label = row["condition"] if label is None else label
            if row["condition"] != label:
                raise ValueError(f"{path.name}:{line}: condition label changes within one file.")
            time, value = float(row["time"]), float(row["acceleration"])
            if not math.isfinite(time) or not math.isfinite(value) or time < 0:
                raise ValueError(f"{path.name}:{line}: expected finite values and nonnegative time.")
            if times and time <= times[-1]:
                raise ValueError(f"{path.name}:{line}: duplicate or decreasing time.")
            times.append(time)
            values.append(value)
    if len(times) < 2:
        raise ValueError(f"{path.name}: at least two samples are required.")
    return label, times, values


def main():
    destination = BASE / "outputs"
    if destination.exists():
        raise ValueError("outputs already exists; rename it before running again.")
    paths = sorted((BASE / "inputs").glob("*.csv"))
    if len(paths) < 2:
        raise ValueError("At least two CSV files are required in inputs.")
    conditions = [read_condition(path) for path in paths]
    if len({label for label, _, _ in conditions}) != len(conditions):
        raise ValueError("Condition labels must be unique across files.")
    reference_times = conditions[0][1]
    if any(times != reference_times for _, times, _ in conditions[1:]):
        raise ValueError("Time samples do not match; check alignment before comparison.")

    figure, axis = plt.subplots(figsize=(8, 4.6), layout="constrained")
    for label, times, values in conditions:
        axis.plot(times, values, marker="o", linewidth=2, label=label)
    axis.set(title="Test conditions | Explanatory synthetic data", xlabel="Elapsed time (s)", ylabel="Acceleration (m/s²)")
    axis.spines[["top", "right"]].set_visible(False)
    axis.grid(alpha=0.2)
    axis.legend(frameon=False)
    destination.mkdir(exist_ok=False)
    with (destination / "comparison_summary.csv").open("x", encoding="utf-8-sig", newline="") as file:
        writer = csv.writer(file)
        writer.writerow(["dataset_note", "condition", "sample_count", "min_acceleration", "max_acceleration", "unit"])
        for label, _, values in conditions:
            writer.writerow([NOTE, label, len(values), min(values), max(values), "m/s^2"])
    figure.savefig(destination / "synthetic_comparison.png", dpi=160)
    plt.close(figure)
    print(f"Explanatory synthetic data: {len(conditions)} conditions, {len(reference_times)} matching time samples each.")
    print("Created outputs/comparison_summary.csv and outputs/synthetic_comparison.png.")


if __name__ == "__main__":
    try:
        main()
    except (OSError, ValueError, csv.Error) as error:
        raise SystemExit(f"Stopped: {error}") from error
outputs/synthetic_comparison.png에 세 조건이 겹쳐 그려집니다. outputs/comparison_summary.csv에는 조건별 표본 수와 가속도 최솟값·최댓값이 저장됩니다. 이 숫자는 설명용 합성 데이터의 단순 요약입니다.
| 조건 | 표본 수 | 최솟값 | 최댓값 |
|---|---|---|---|
| Case A | 6 | 0.0 m/s² | 1.4 m/s² |
| Case B | 6 | 0.0 m/s² | 1.1 m/s² |
| Case C | 6 | 0.0 m/s² | 1.7 m/s² |
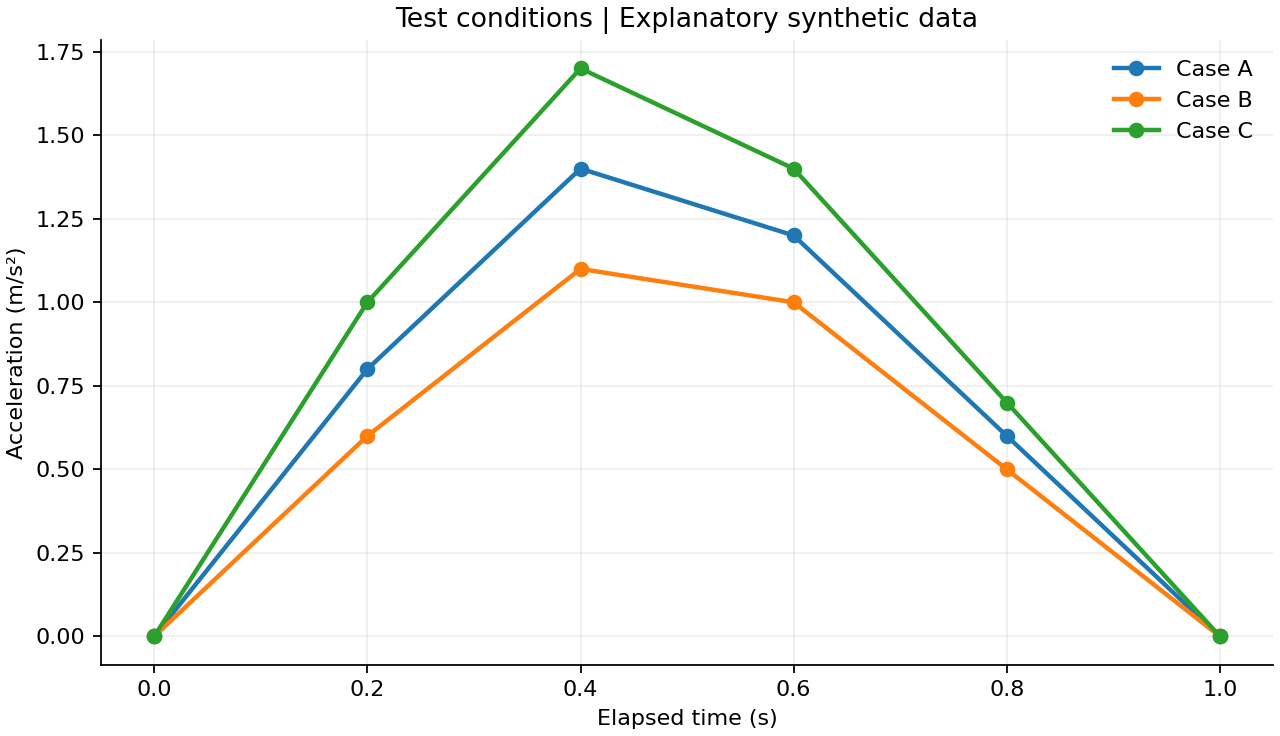
세 곡선의 0.4초 표본에서 값은 각각 1.4, 1.1, 1.7 m/s²입니다. 그래프의 선은 표본 사이를 연결한 것으로, 그 사이의 실제 계측값을 새로 생성한 것은 아닙니다.
| 메시지 | 확인 순서 |
|---|---|
| expected units s and m/s^2 | 내보낸 파일의 실제 단위와 표기를 확인합니다. |
| duplicate or decreasing time | 해당 파일·행의 시간 순서를 확인합니다. |
| Time samples do not match | 시작 시각, 표본 주기, 누락 표본을 확인합니다. 원인을 모른 채 시간만 덮어쓰지 않습니다. |
| Condition labels must be unique | 파일마다 서로 다른 조건 이름을 사용합니다. |
| condition label changes | 한 파일 안에 여러 조건이 섞이지 않았는지 확인합니다. |
| At least two CSV files | 입력 파일이 inputs 폴더에 있는지 확인합니다. |
Windows 11 (10.0.26200), CPython 3.12.14 (64비트). openpyxl 3.1.5, Matplotlib 3.10.8. 예제별 사용 라이브러리는 requirements.txt에 고정했습니다.
코드·입력 데이터·실행 안내가 포함되어 있습니다. 압축을 풀고 README.txt부터 읽어 주세요.
예제 ZIP 다운로드직접 작성한 연습 자료 · 원본을 따로 보관한 뒤 실행하세요.
설명과 예제는 직접 작성했습니다. 관련 동작과 개념은 아래 공식 자료에서 확인할 수 있습니다.