自動車・データ実務10
まず試験 CSV の時間軸と単位を確認する
合成の demonstration data で units、missing values、finite numbers、duplicate または reversed timestamps を確認し、その後 check results と chart を保存します。
3つの合成デモ CSV ファイルを検証し、同じ時刻サンプルと加速度単位を共有する曲線を1つのグラフに重ねて表示します。
この翻訳はAIで作成しました。コード、単位、数値は原文と併せて確認してください。各言語のネイティブ話者による校閲は、まだ完了していません。 English
対象読者複数条件の試験結果を重ねて比較したい自動車分野の Python 初学者
複数の曲線を1つのグラフに重ねるには、time と縦軸の units が同じ意味を持っている必要があります。この例では、合成デモデータ Case A, Case B, Case C を、time は s、acceleration は m/s^2 の共通軸上に描画します。condition 名は各ファイルの condition 列から読み取ります。
スクリプトは inputs フォルダ内の .csv ファイルを名前順に読み取ります。ファイルは少なくとも2つ必要で、各ファイルには1つの condition だけを含める必要があります。すべての行には dataset_note, condition, time, time_unit, acceleration, acceleration_unit の6列が必要です。
| フィールド | 付属例 |
|---|---|
| dataset_note | Synthetic demonstration data |
| condition | Case A (ASCII letters and numbers) |
| time / time_unit | 0.0 / s |
| acceleration / acceleration_unit | 0.8 / m/s^2 |
この例では、各ファイルの time arrays が完全に同じ場合だけ比較します。sample 数、開始時刻、またはいずれかの time value が異なる場合は停止します。グラフの軸には共有単位として m/s² を表示します。
python --version
python -m pip install -r requirements.txt
python example.py
インストールにはインターネット接続が必要です。コード内の BASE は、現在のターミナルフォルダではなく example.py を基準に入力・出力パスを設定します。
各ファイルの time order と units を確認した後、condition 名の重複を確認します。その後、残りの arrays を最初のファイルの time array と比較し、すべて一致する場合だけ1つの Axes に線を追加します。sorting, time shifting, interpolation, unit conversion は自動では行いません。
"""Overlay explanatory synthetic test conditions on the same axes.

All files must have the same explicit units and matching time samples.
No interpolation, clock shifting, filtering, or safety assessment is performed.
"""
import csv
import math
from pathlib import Path

import matplotlib
matplotlib.use("Agg")
import matplotlib.pyplot as plt

BASE = Path(__file__).resolve().parent
HEADERS = ["dataset_note", "condition", "time", "time_unit", "acceleration", "acceleration_unit"]
NOTE = "설명용 합성 데이터"


def read_condition(path):
    times, values = [], []
    label = None
    with path.open(encoding="utf-8-sig", newline="") as file:
        reader = csv.DictReader(file)
        if reader.fieldnames != HEADERS:
            raise ValueError(f"{path.name}: expected headers {HEADERS}")
        for line, row in enumerate(reader, start=2):
            if None in row or any(value is None or not value.strip() for value in row.values()):
                raise ValueError(f"{path.name}:{line}: missing or extra field.")
            if row["dataset_note"] != NOTE:
                raise ValueError(f"{path.name}:{line}: synthetic-data label is required.")
            if row["time_unit"] != "s" or row["acceleration_unit"] != "m/s^2":
                raise ValueError(f"{path.name}:{line}: expected units s and m/s^2; no automatic conversion.")
            if not row["condition"].isascii():
                raise ValueError(f"{path.name}:{line}: use an ASCII condition label for portable plotting.")
            label = row["condition"] if label is None else label
            if row["condition"] != label:
                raise ValueError(f"{path.name}:{line}: condition label changes within one file.")
            time, value = float(row["time"]), float(row["acceleration"])
            if not math.isfinite(time) or not math.isfinite(value) or time < 0:
                raise ValueError(f"{path.name}:{line}: expected finite values and nonnegative time.")
            if times and time <= times[-1]:
                raise ValueError(f"{path.name}:{line}: duplicate or decreasing time.")
            times.append(time)
            values.append(value)
    if len(times) < 2:
        raise ValueError(f"{path.name}: at least two samples are required.")
    return label, times, values


def main():
    destination = BASE / "outputs"
    if destination.exists():
        raise ValueError("outputs already exists; rename it before running again.")
    paths = sorted((BASE / "inputs").glob("*.csv"))
    if len(paths) < 2:
        raise ValueError("At least two CSV files are required in inputs.")
    conditions = [read_condition(path) for path in paths]
    if len({label for label, _, _ in conditions}) != len(conditions):
        raise ValueError("Condition labels must be unique across files.")
    reference_times = conditions[0][1]
    if any(times != reference_times for _, times, _ in conditions[1:]):
        raise ValueError("Time samples do not match; check alignment before comparison.")

    figure, axis = plt.subplots(figsize=(8, 4.6), layout="constrained")
    for label, times, values in conditions:
        axis.plot(times, values, marker="o", linewidth=2, label=label)
    axis.set(title="Test conditions | Explanatory synthetic data", xlabel="Elapsed time (s)", ylabel="Acceleration (m/s²)")
    axis.spines[["top", "right"]].set_visible(False)
    axis.grid(alpha=0.2)
    axis.legend(frameon=False)
    destination.mkdir(exist_ok=False)
    with (destination / "comparison_summary.csv").open("x", encoding="utf-8-sig", newline="") as file:
        writer = csv.writer(file)
        writer.writerow(["dataset_note", "condition", "sample_count", "min_acceleration", "max_acceleration", "unit"])
        for label, _, values in conditions:
            writer.writerow([NOTE, label, len(values), min(values), max(values), "m/s^2"])
    figure.savefig(destination / "synthetic_comparison.png", dpi=160)
    plt.close(figure)
    print(f"Explanatory synthetic data: {len(conditions)} conditions, {len(reference_times)} matching time samples each.")
    print("Created outputs/comparison_summary.csv and outputs/synthetic_comparison.png.")


if __name__ == "__main__":
    try:
        main()
    except (OSError, ValueError, csv.Error) as error:
        raise SystemExit(f"Stopped: {error}") from error
3つの conditions は outputs/synthetic_comparison.png に重ねて表示されます。outputs/comparison_summary.csv には、各 condition の samples 数と acceleration の minimum, maximum が保存されます。これらの数値は合成デモデータの簡単な要約です。
| Condition | Samples | Minimum | Maximum |
|---|---|---|---|
| Case A | 6 | 0.0 m/s² | 1.4 m/s² |
| Case B | 6 | 0.0 m/s² | 1.1 m/s² |
| Case C | 6 | 0.0 m/s² | 1.7 m/s² |
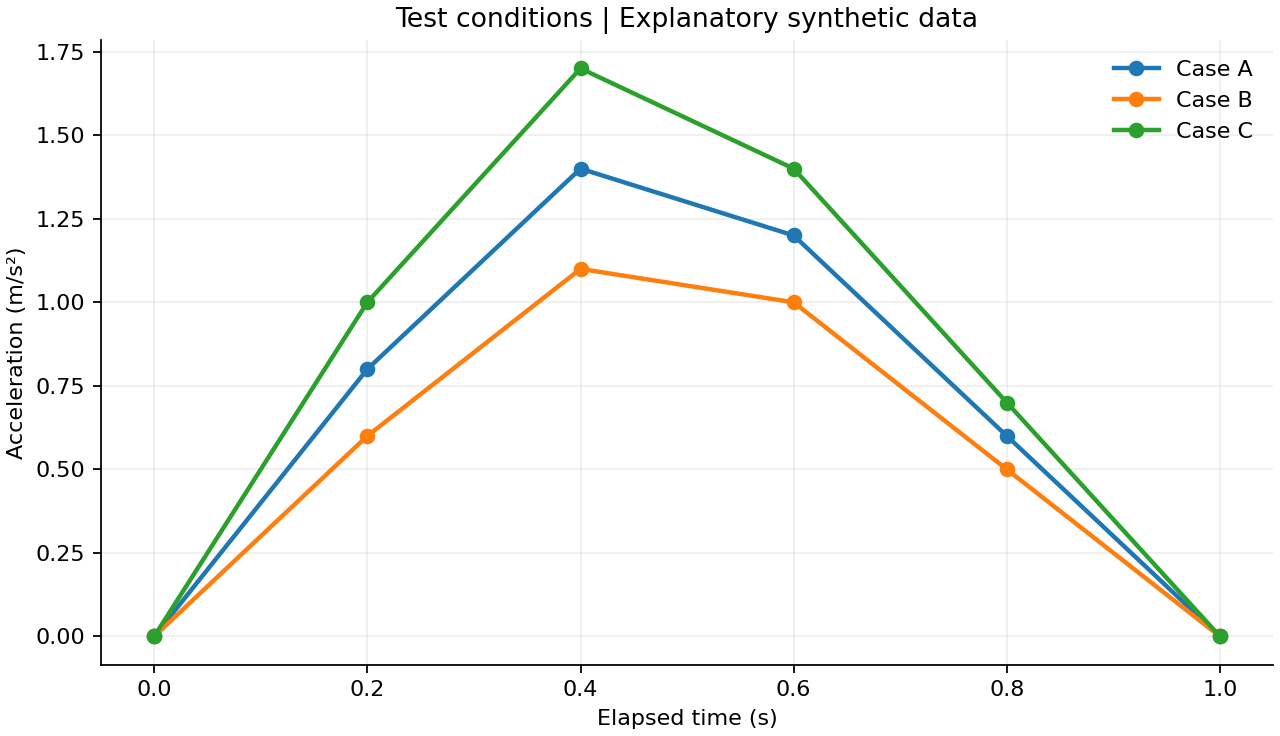
0.4 s の sample では、3本の曲線の値は 1.4, 1.1, 1.7 m/s² です。グラフの線は samples 間を接続しているだけで、その間に新しい measured values を作成するものではありません。
| メッセージ | 確認すること |
|---|---|
| expected units s and m/s^2 | exported file の実際の units と表記を確認します。 |
| duplicate or decreasing time | そのファイルと行の time order を確認します。 |
| Time samples do not match | 開始時刻、sampling interval、missing samples を確認します。原因を把握せずに times を単純に上書きしないでください。 |
| Condition labels must be unique | 各ファイルで異なる condition name を使用します。 |
| condition label changes | 1つのファイルに複数の conditions が混在していないか確認します。 |
| At least two CSV files | 入力ファイルが inputs フォルダにあることを確認します。 |
Windows 11 (10.0.26200), CPython 3.12.14 (64-bit). openpyxl 3.1.5, Matplotlib 3.10.8. 各例で使用するライブラリは requirements.txt に固定されています。
コード、入力データ、実行手順が含まれています。展開して、まずREADME.txtを読んでください。
サンプルZIPをダウンロードサンプルコード、ファイル名、入力キーは原文のままです。翻訳本文のコマンドと確認手順も併せて参照してください。
独自に作成した練習用資料 · 元のファイルを別に保管してから実行してください。
説明と例は独自に作成しました。関連する動作や概念は、以下の公式資料で確認できます。