自動車・データ実務11
複数の試験条件を同じ時間軸で比較する
3つの合成デモ CSV ファイルを検証し、同じ時刻サンプルと加速度単位を共有する曲線を1つのグラフに重ねて表示します。
合成の demonstration data で units、missing values、finite numbers、duplicate または reversed timestamps を確認し、その後 check results と chart を保存します。
この翻訳はAIで作成しました。コード、単位、数値は原文と併せて確認してください。各言語のネイティブ話者による校閲は、まだ完了していません。 English
対象読者Python で初めて vehicle test CSV を読むエンジニアと初学者向けです。
まず synthetic demonstration data の file structure, numbers, units, time order を確認します。values を読めることだけでは、units が正しいことや times が正しいことは分かりません。この例では、すべての input row に s と km/h が記載されていることと、original row order で time が増加していることを確認します。
| Column | 含まれる値と意味 |
|---|---|
| dataset_note | Synthetic demonstration data |
| time | 0.0 から 1.0 までの elapsed time |
| time_unit | s |
| speed | 0 から 22 までの speed values |
| speed_unit | km/h |
numeric cells に unit strings を付けないでください。units は別の column に記録します。time は negative にできず、少なくとも2 samples が必要です。この code では speed の physically normal range は定義しません。
python --version
python -m pip install -r requirements.txt
python example.py
installation には internet connection が必要です。code 内の BASE は current terminal folder ではなく example.py を基準に input と output paths を設定します。
CSV の各 row を読むときに missing values と units を確認します。math.isfinite は NaN と infinity を拒否します。current time が previous time 以下の場合は停止するため、sort して問題を隠したり、duplicate samples を任意に削除したりしません。outputs は input check が完了した後にだけ作成されます。
"""Check time order and declared units in explanatory synthetic test data.

This demonstrates file checks only. It makes no vehicle safety assessment.
"""
import csv
import json
import math
from pathlib import Path

import matplotlib
matplotlib.use("Agg")
import matplotlib.pyplot as plt

BASE = Path(__file__).resolve().parent
HEADERS = ["dataset_note", "time", "time_unit", "speed", "speed_unit"]
NOTE = "설명용 합성 데이터"


def read_samples():
    samples = []
    with (BASE / "synthetic_test.csv").open(encoding="utf-8-sig", newline="") as file:
        reader = csv.DictReader(file)
        if reader.fieldnames != HEADERS:
            raise ValueError(f"Expected headers: {HEADERS}")
        for line, row in enumerate(reader, start=2):
            if None in row or any(value is None or not value.strip() for value in row.values()):
                raise ValueError(f"Row {line}: missing or extra field.")
            if row["dataset_note"] != NOTE:
                raise ValueError(f"Row {line}: explanatory synthetic-data label is required.")
            if row["time_unit"] != "s" or row["speed_unit"] != "km/h":
                raise ValueError(f"Row {line}: expected units s and km/h; no automatic conversion.")
            time, speed = float(row["time"]), float(row["speed"])
            if not math.isfinite(time) or not math.isfinite(speed):
                raise ValueError(f"Row {line}: NaN and infinite values are not supported.")
            if time < 0:
                raise ValueError(f"Row {line}: elapsed time must be nonnegative.")
            if samples and time <= samples[-1][0]:
                raise ValueError(f"Row {line}: duplicate or decreasing time; check the source.")
            samples.append((time, speed))
    if len(samples) < 2:
        raise ValueError("At least two samples are required.")
    return samples


def main():
    destination = BASE / "outputs"
    if destination.exists():
        raise ValueError("outputs already exists; rename it before running again.")
    samples = read_samples()
    times, speeds = zip(*samples)
    intervals = [right - left for left, right in zip(times, times[1:])]
    report = {
        "dataset_note": NOTE,
        "scope": "File structure and numeric checks only; no vehicle safety assessment.",
        "sample_count": len(samples), "time_unit": "s", "speed_unit": "km/h",
        "start_time": times[0], "end_time": times[-1],
        "min_interval_s": min(intervals), "max_interval_s": max(intervals),
        "min_speed_kmh": min(speeds), "max_speed_kmh": max(speeds),
        "time_strictly_increasing": True,
    }
    figure, axis = plt.subplots(figsize=(8, 4.6), layout="constrained")
    axis.plot(times, speeds, "o-", color="#2B6578", linewidth=2)
    axis.set(title="Speed trace | Explanatory synthetic data", xlabel="Elapsed time (s)", ylabel="Speed (km/h)")
    axis.spines[["top", "right"]].set_visible(False)
    axis.grid(alpha=0.2)
    destination.mkdir(exist_ok=False)
    with (destination / "data_check.json").open("x", encoding="utf-8") as file:
        json.dump(report, file, ensure_ascii=False, indent=2)
    figure.savefig(destination / "synthetic_speed.png", dpi=160)
    plt.close(figure)
    print(f"Explanatory synthetic data: {len(samples)} samples, {times[0]:g}-{times[-1]:g} s.")
    print(f"Sample interval: {min(intervals):g}-{max(intervals):g} s; units: s, km/h.")
    print("Created outputs/data_check.json and outputs/synthetic_speed.png.")


if __name__ == "__main__":
    try:
        main()
    except (OSError, ValueError, csv.Error) as error:
        raise SystemExit(f"Stopped: {error}") from error
outputs/data_check.json には units, number of samples, time range, minimum and maximum sampling interval が記録されます。outputs/synthetic_speed.png は同じ synthetic demonstration data の chart です。
| 項目 | 付属 synthetic demonstration data の結果 |
|---|---|
| Samples | 6 |
| Time range | 0.0~1.0 s |
| Sampling interval | About 0.2 s |
| Speed minimum / maximum | 0 / 22 km/h |
| Time increasing | true |
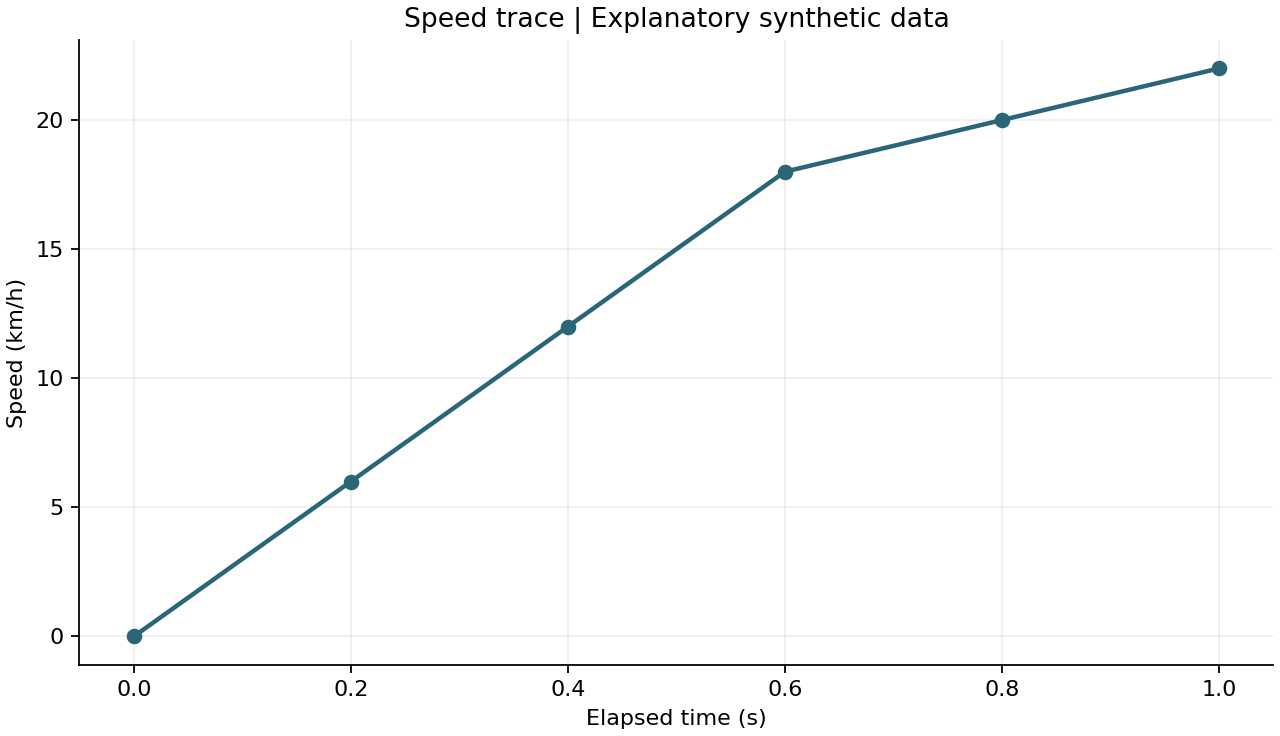
floating-point representation のため、JSON の sampling interval が 0.19999999999999996 と表示される場合があります。これは input values や measurement resolution に追加の precision があると主張する数値ではありません。
| Message | original で確認すること |
|---|---|
| expected units s and km/h | export settings が各 row の units と一致しているか確認します。code は自動変換しません。 |
| duplicate or decreasing time | restart, duplicate samples, file merging の途中で time order が変わっていないか確認します。 |
| NaN and infinite values | original に missing samples や calculation errors がないか確認します。 |
| synthetic-data label is required | この tutorial 専用の synthetic demonstration data であることを示す label を保持します。 |
| missing or extra field | commas の数、blank cells、column names を確認します。 |
Windows 11 (10.0.26200), CPython 3.12.14 (64-bit). openpyxl 3.1.5, Matplotlib 3.10.8. 各 example で使用する libraries は requirements.txt に固定されています。
コード、入力データ、実行手順が含まれています。展開して、まずREADME.txtを読んでください。
サンプルZIPをダウンロードサンプルコード、ファイル名、入力キーは原文のままです。翻訳本文のコマンドと確認手順も併せて参照してください。
独自に作成した練習用資料 · 元のファイルを別に保管してから実行してください。
説明と例は独自に作成しました。関連する動作や概念は、以下の公式資料で確認できます。